Exploratory Data Analysis
A thorough first look at your data that shows what it can support, what it cannot, and where the real story is hiding.
What Our Exploratory Data Analysis Service Covers
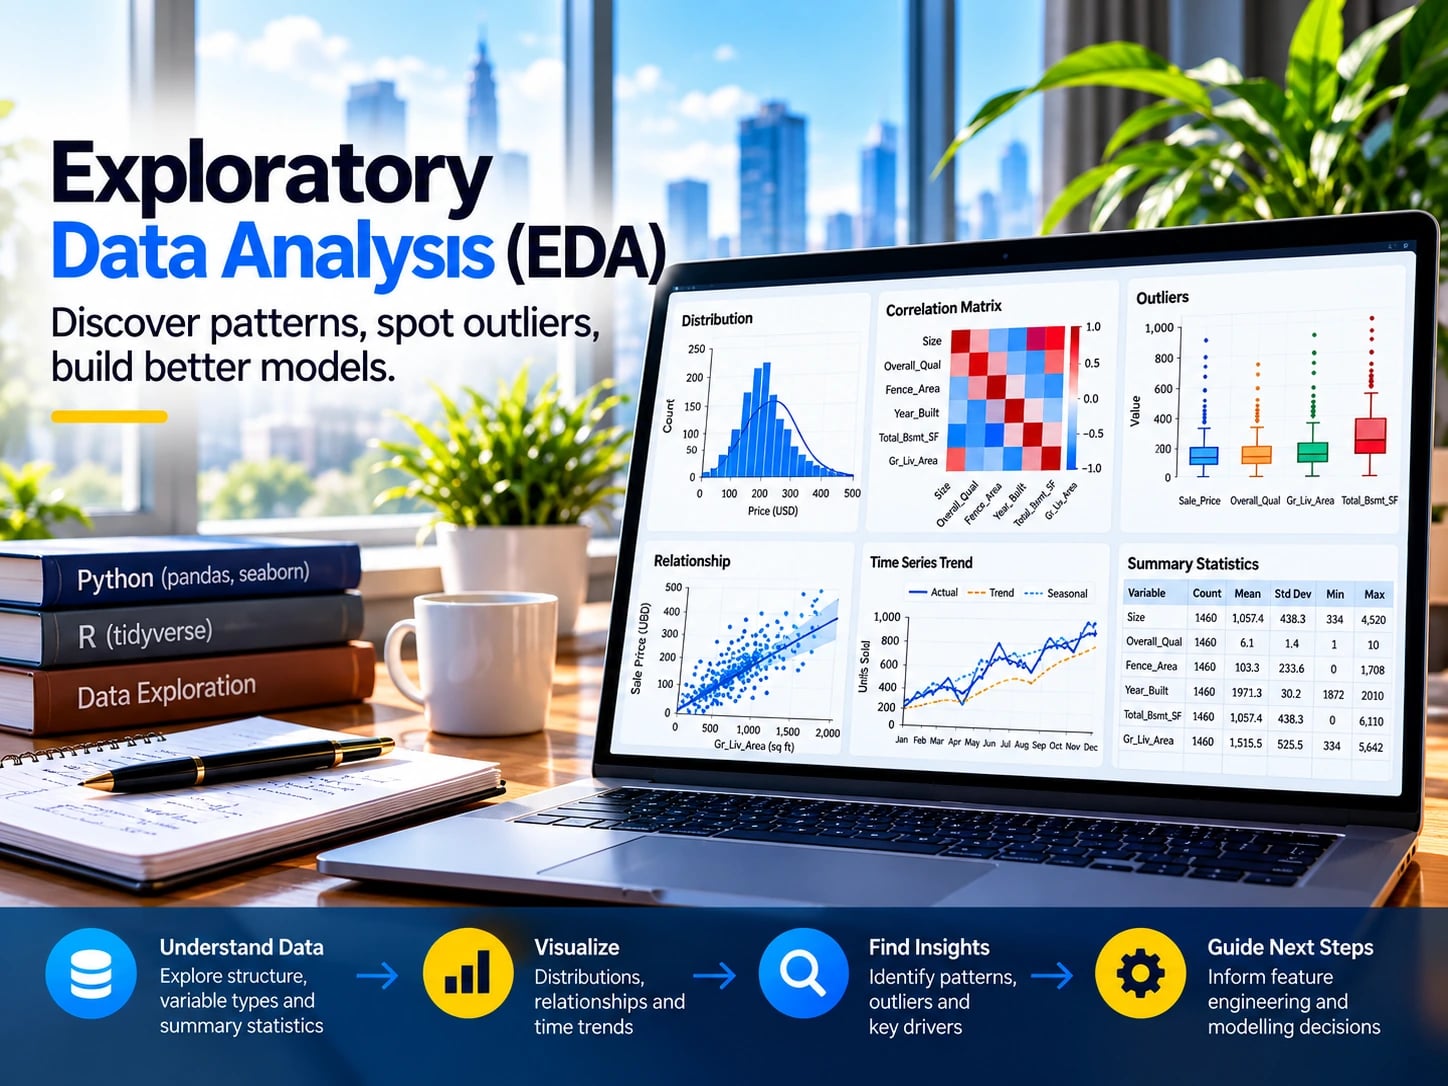
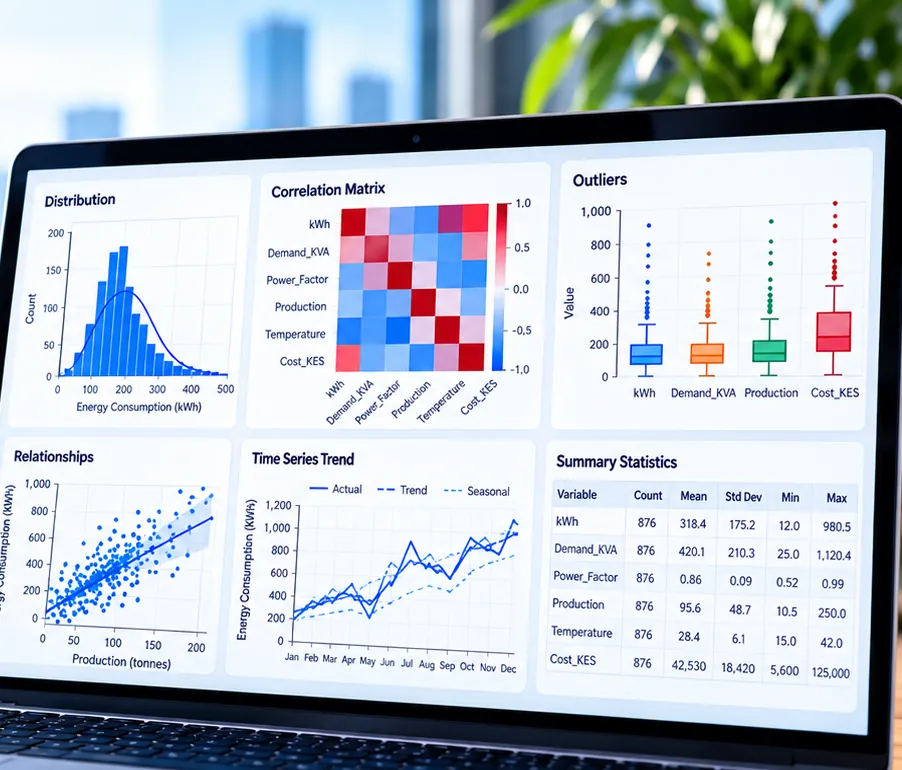
A deep first pass through your data to surface the patterns, anomalies and relationships that decide how the rest of the project should run. Working in Python with Pandas, Seaborn and ydata profiling, or in R where the analysis calls for it, we profile every distribution, build correlation matrices, test for outliers and missingness, and engineer the features your later models will depend on. You receive a visual narrative that states plainly what your data supports and, just as usefully, what it cannot support. Teams routinely revise their modelling plan after this stage, which is precisely why it runs first.
What's Included
Every engagement is scoped in writing, but these are the deliverables you can expect as standard.
Data profile
Types, ranges, distributions, missingness and duplicates for every variable, summarised in one readable report.
Relationship analysis
Correlation matrices, cross tabulations and grouped comparisons that show how your variables move together.
Outlier review
Unusual values flagged and investigated, with a recommendation to keep, correct or exclude each one.
Feature engineering
Derived variables, encodings and transformations prepared for the modelling or reporting that follows.
Visual narrative
A short illustrated report that explains the key patterns in plain language for a non technical audience.
Reproducible notebook
The full Python or R notebook, so every chart can be regenerated when new data arrives.
Built for Teams Like Yours
If any of these sound familiar, this service is a good place to start.
- Teams about to invest in a predictive model
- Analysts inheriting a dataset they did not collect
- Researchers checking assumptions before formal testing
- Managers who suspect their reports are missing something
From Brief to Delivery
- 01
Frame the questions
We agree what decisions the analysis should inform so exploration stays focused.
- 02
Profile and clean
Every column is profiled and quality issues are logged before any patterns are interpreted.
- 03
Explore and test
We visualise, compare segments and test early hypotheses, discarding the ones the data does not support.
- 04
Report findings
You receive the narrative report, the notebook and a call to walk through what we found.
Exploratory Data Analysis FAQs
How is this different from a dashboard?
A dashboard monitors known metrics. Exploratory analysis is how you find out which metrics and relationships matter in the first place.
How much data do we need?
There is no fixed minimum. We will tell you early if the sample is too small for the questions you want to answer.
Can this lead into modelling?
Yes, and it usually should. The features and findings from this stage feed directly into our predictive analytics work.