Predictive ML

Customer Churn Prediction for Telecom Startup

A Python classification pipeline combining Random Forest and XGBoost to flag at-risk customers before they churn, with SHAP attribution surfaced back to the retention team through an interactive dashboard.

Client
Telecom Startup (confidential case)
Industry
Telecommunications
Duration
5 weeks
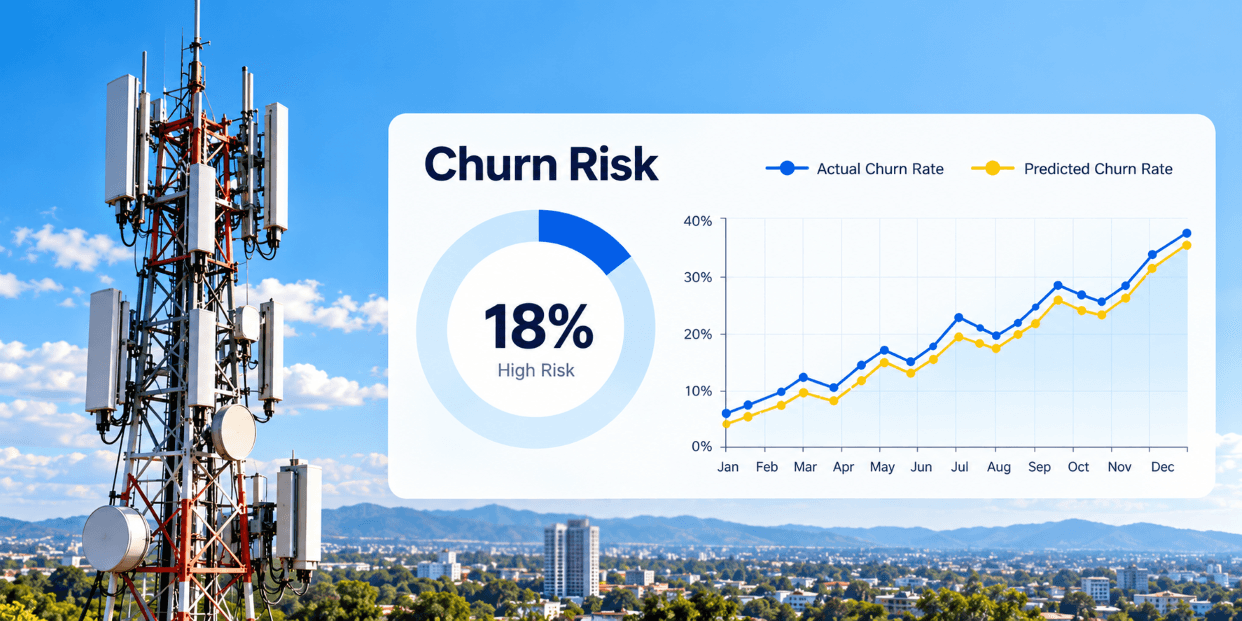
Telecom mast against a sunset sky beside a churn risk dashboard showing an 18 percent high-risk share and its key drivers
77%
ROC-AUC Score
70.5%
Churners Correctly Flagged
6,000
Customer Accounts Modeled
The Challenge

What the client was facing

The client, an early-stage telecom operator, was losing customers faster than its sales team could replace them — but had no way to tell which customers were at risk until after they had already cancelled.

Retention offers were being sent reactively, weeks after warning signs appeared in the account data, or blasted out to the entire customer base regardless of actual risk. Both approaches wasted budget and annoyed customers who were never going to leave.

The brief called for a model that didn't just predict who would churn, but explained why , so the retention team could act on the driver, not just the score.
Our Approach

How we tackled it

Feature engineering. Consolidated account tenure, contract type, billing history, service add-ons, usage trend, and customer support interactions into a single modeling table of 15 features per customer.

Model comparison. Trained Random Forest and XGBoost classifiers in parallel, both with class-weight balancing to handle the natural imbalance between churned and retained customers.

Hyperparameter tuning. Ran a randomized search across 40 parameter combinations with 5-fold stratified cross-validation, optimizing directly for ROC-AUC rather than raw accuracy .The metric that matters when missed churners are the real cost.

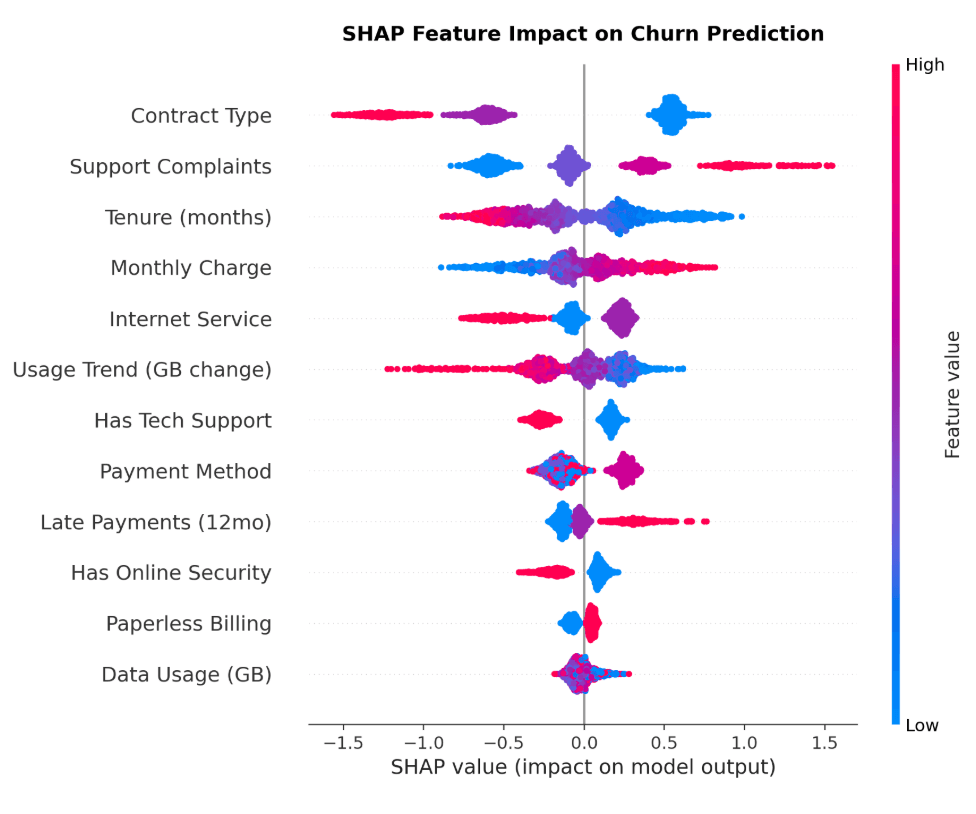
Explainability. Computed SHAP (SHapley Additive exPlanations) values for every prediction in the test set, so each flagged customer comes with the top three factors driving their risk score, not just a number.

Validation. Held out 25% of customers as a test set never seen during training or tuning, and confirmed the result with 5-fold cross-validation to rule out an overfit or lucky split.

The Results

What changed

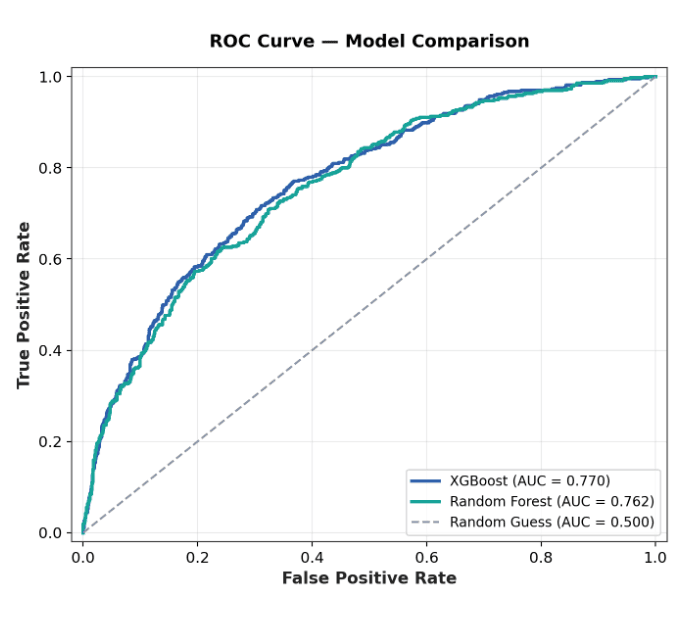
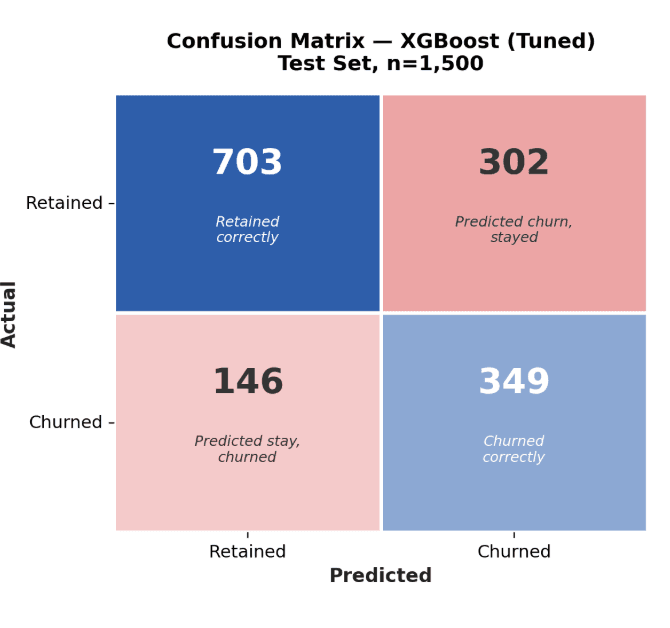
The tuned XGBoost model reached 77.0% ROC-AUC and 70.5% recall on held-out data ,catching roughly seven in ten customers who went on to churn, validated across a 5-fold cross-validation (0.771 ± 0.021).

SHAP analysis confirmed the retention team's intuitions and gave them hard numbers to act on:

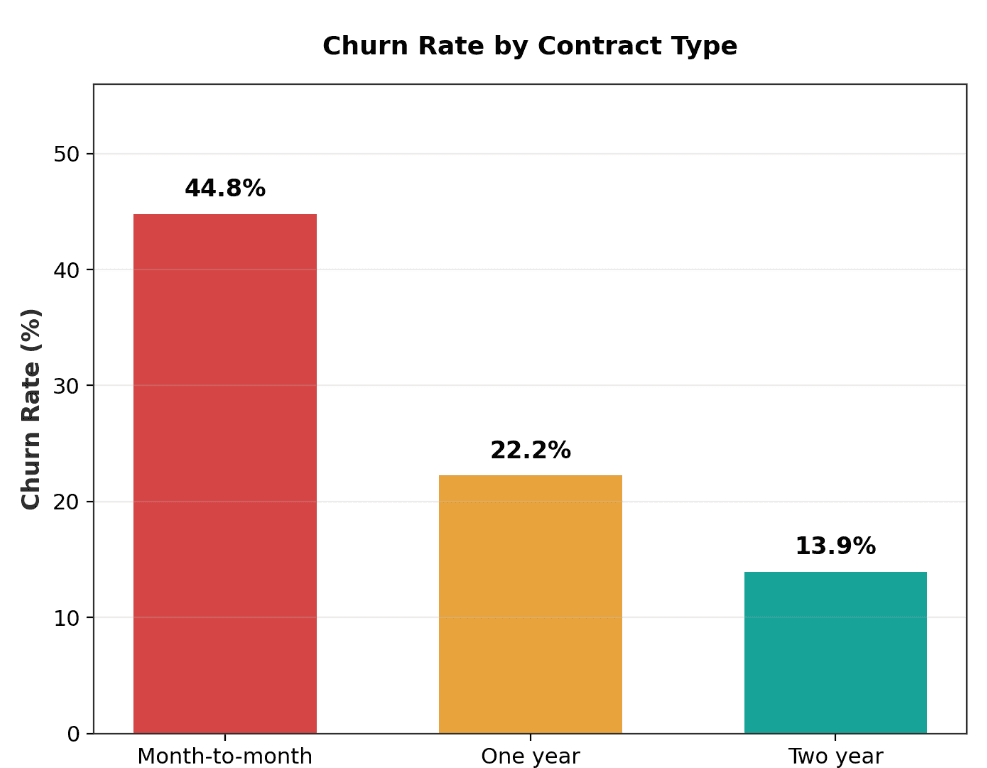
  • Contract type was the single strongest driver — month-to-month customers churned at more than 3x the rate of two-year contract holders
  • Support complaints compounded risk sharply: customers with 4+ complaints churned over 60% of the time
  • Tech support and online security add-ons acted as genuine retention levers, measurably lowering churn risk when present

The client's retention team now works from a live risk score per customer, with the top drivers attached .This turned a blind and a reactive process into a targeted one.

Gallery

Inside the Project

Confusion Matrix
Features impacting Churn
Churn rate by contract types
ROC Curve
Keep Exploring

More Case Studies

View all case studies →